Campaign Analytics
Fluentos enables you to view and analyze your campaign analytics to improve your strategies when designing and launching future campaigns. The following sections give you an insight into campaign performance for each published campaign for the time period when the campaign was active.
- Performance Over Time
- Performance Summary
- Impressions by Device
- Campaign Step Funnel
- Engagement by Medium
- Goal Completions by Medium
Let’s have a look at each section one by one, and then we’ll see how you can use the available filters to customize the analytics view.
1. Performance Over Time
Section titled “1. Performance Over Time”This section displays you the collective graphs for the following stats of your campaign. You can always enable/disable a graph by clicking on the icon given next to its label on the top.
- Clickthrough Rate (CTR): It is represented by a dark purple line graph. Its scale in percentage (%) is on the left side of the graph. At any given point, CTR is determined by the number of clicks.
- Conversion Rate (CR): It is represented by a light purple line graph. Its scale in percentage (%) is on the right side of the graph. At any given point, CR is determined by the number of events.
- Impressions: It’s the total number of times the campaign appeared for the users. The graph for impressions is represnted as an area chart as a the grey-color shaded region behind the line graphs.

2. Performance Summary
Section titled “2. Performance Summary”This section shows you the stats in numerial format i.e., you can see the exact number of clicks, events, and impressions your campaign received.
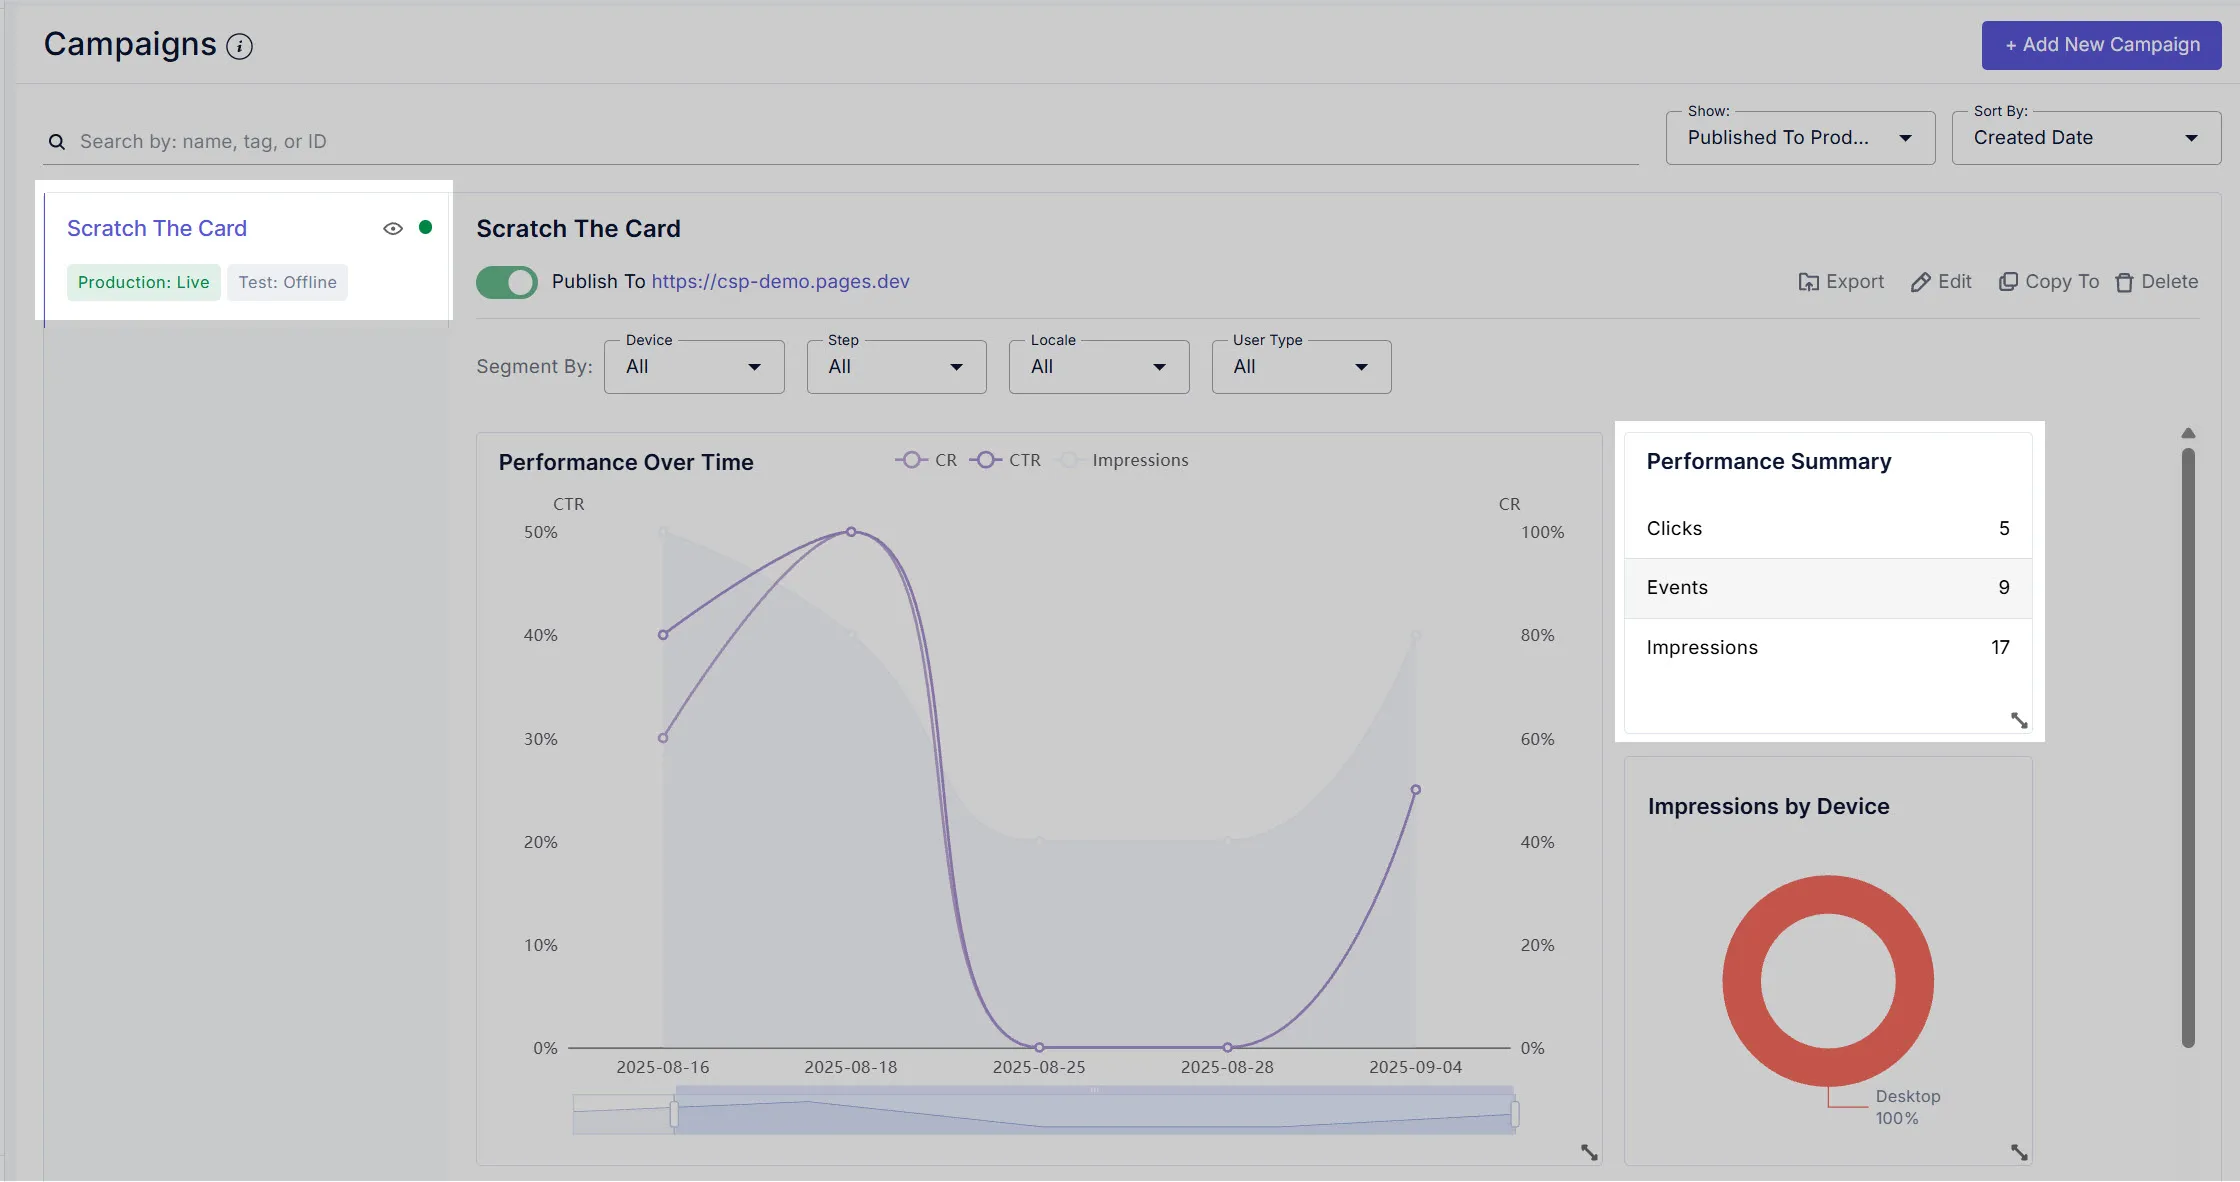
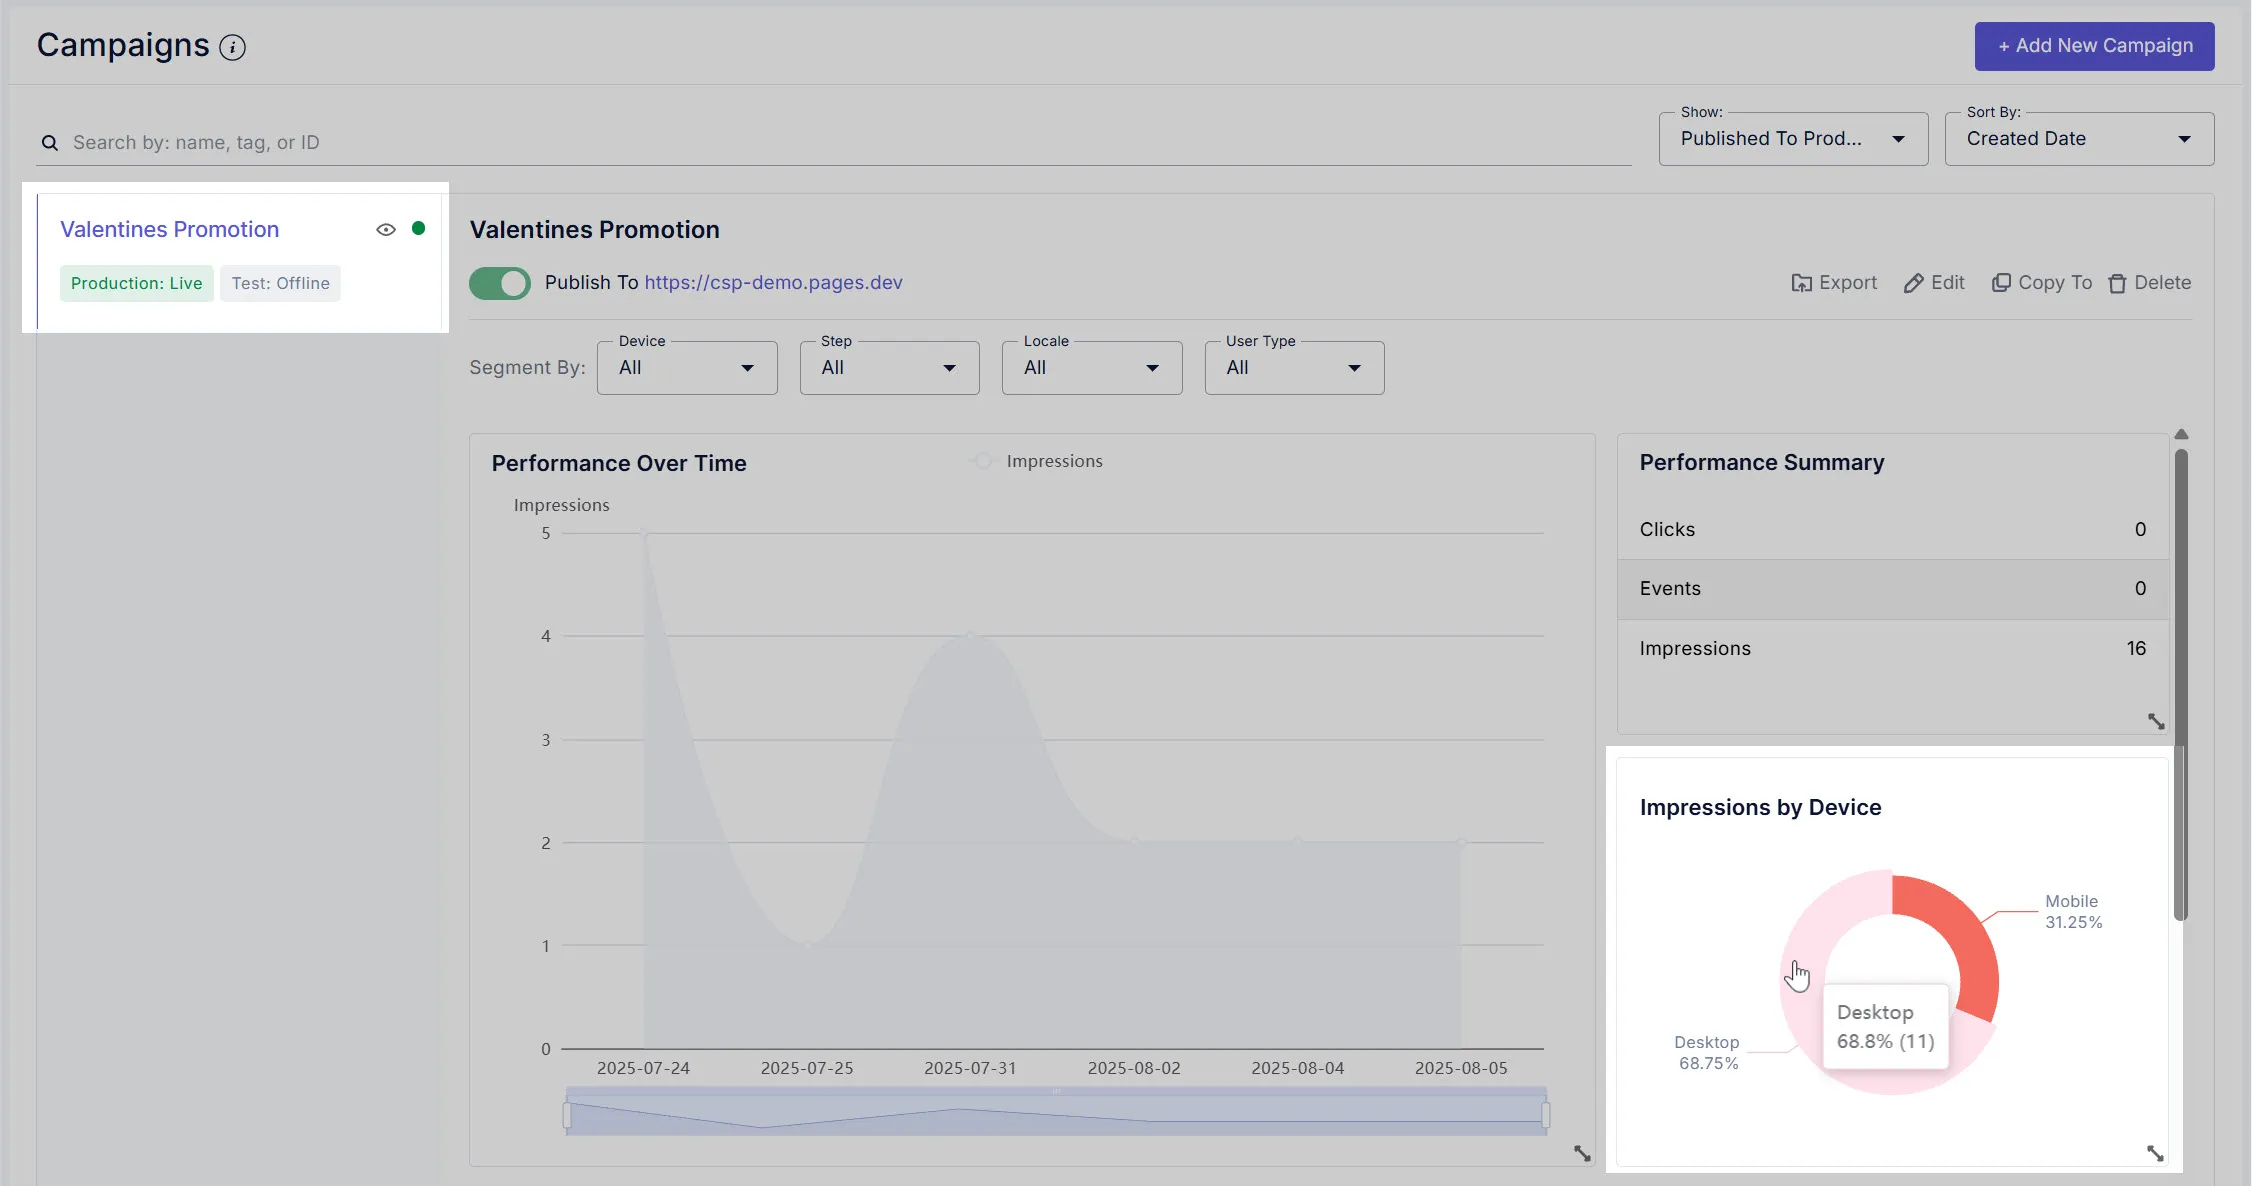
3. Impressions By Device
Section titled “3. Impressions By Device”Other than viewing the overall impressions of the campaign in the Performance Over Time graph and number of impressions in the Perfromance Summary section, you can go one step deeper in your analytics and see the impressions for desktop and mobile devices separately.
4. Campaign Step Funnel
Section titled “4. Campaign Step Funnel”This section gives you a clear, step-by-step view of how visitors interact with your popup campaign. Each bar represents a different step in your campaign—like seeing the popup, clicking a button, or completing an action.
- Impressions show how many users reached each step.
- Drop-off rate shows the percent of users who stopped at that step.
- Closed tells you how many users finished the action at that step.
This funnel helps you quickly spot where users lose interest or drop out, so you can improve your campaign and boost conversion. Hovering over any bar gives you detailed stats for that step, making it easy to track your campaign’s performance.
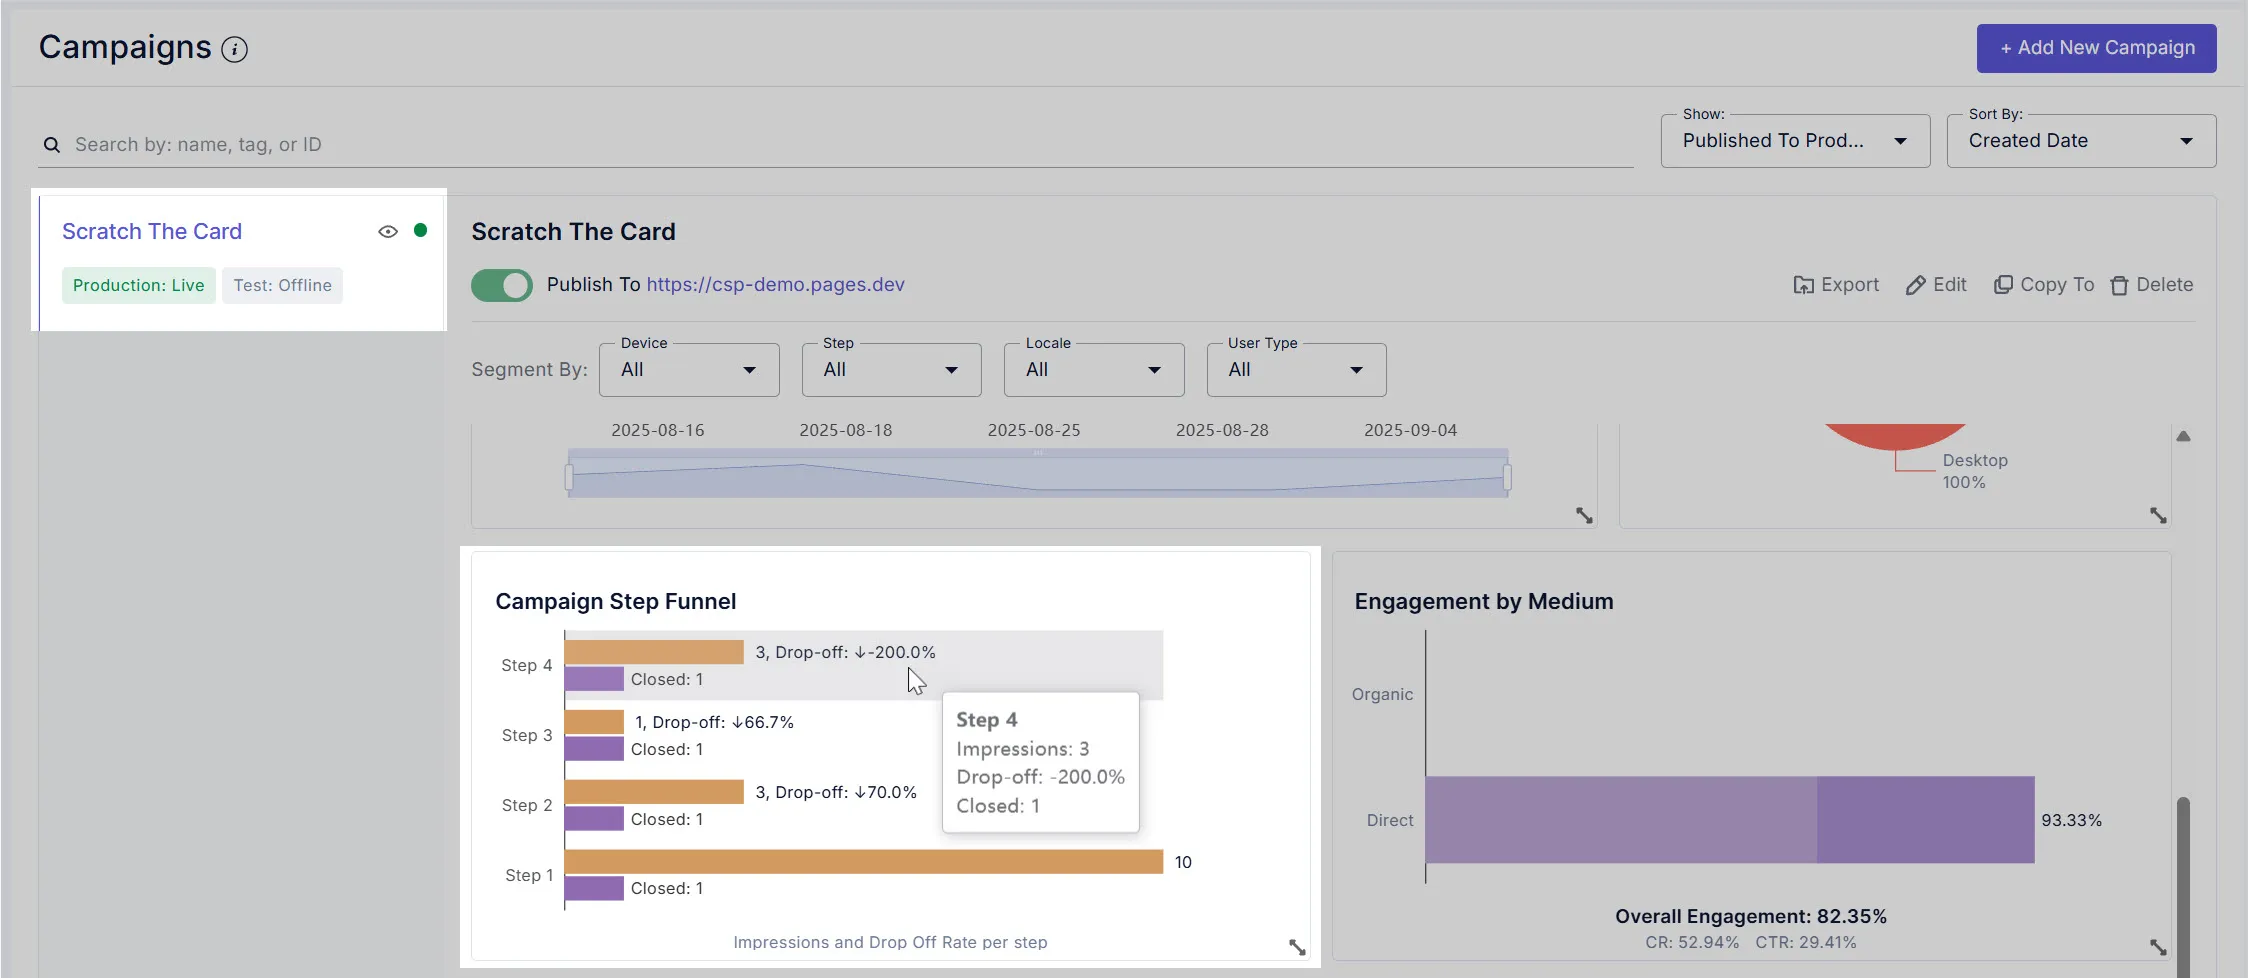
5. Engagement by Medium
Section titled “5. Engagement by Medium”This section helps you see how users interact with your popup campaign, depending on how they found your site. It breaks down stats by the following traffic sourceslike:
- Direct: Users typing the link or coming straight to your site.
- Organic: Users from search engines or unpaid channels.
- Social: Users from social media platforms like Instagram.
- Email: Users from your email campaigns.
- Paid: Users from your paid ads.
For each medium, you can find:
- Impressions: How many times the campaign was seen by users from each source.
- Events: How many actions were taken (like filling a form), and the conversion rate (CR) for these actions.
- Clicks: How many users clicked buttons on your popup, and the click-through rate (CTR).
Hovering over each bar shows a popup with exact numbers and percentages, making it easy to compare which source performs best and where your campaign is getting the most engagement.

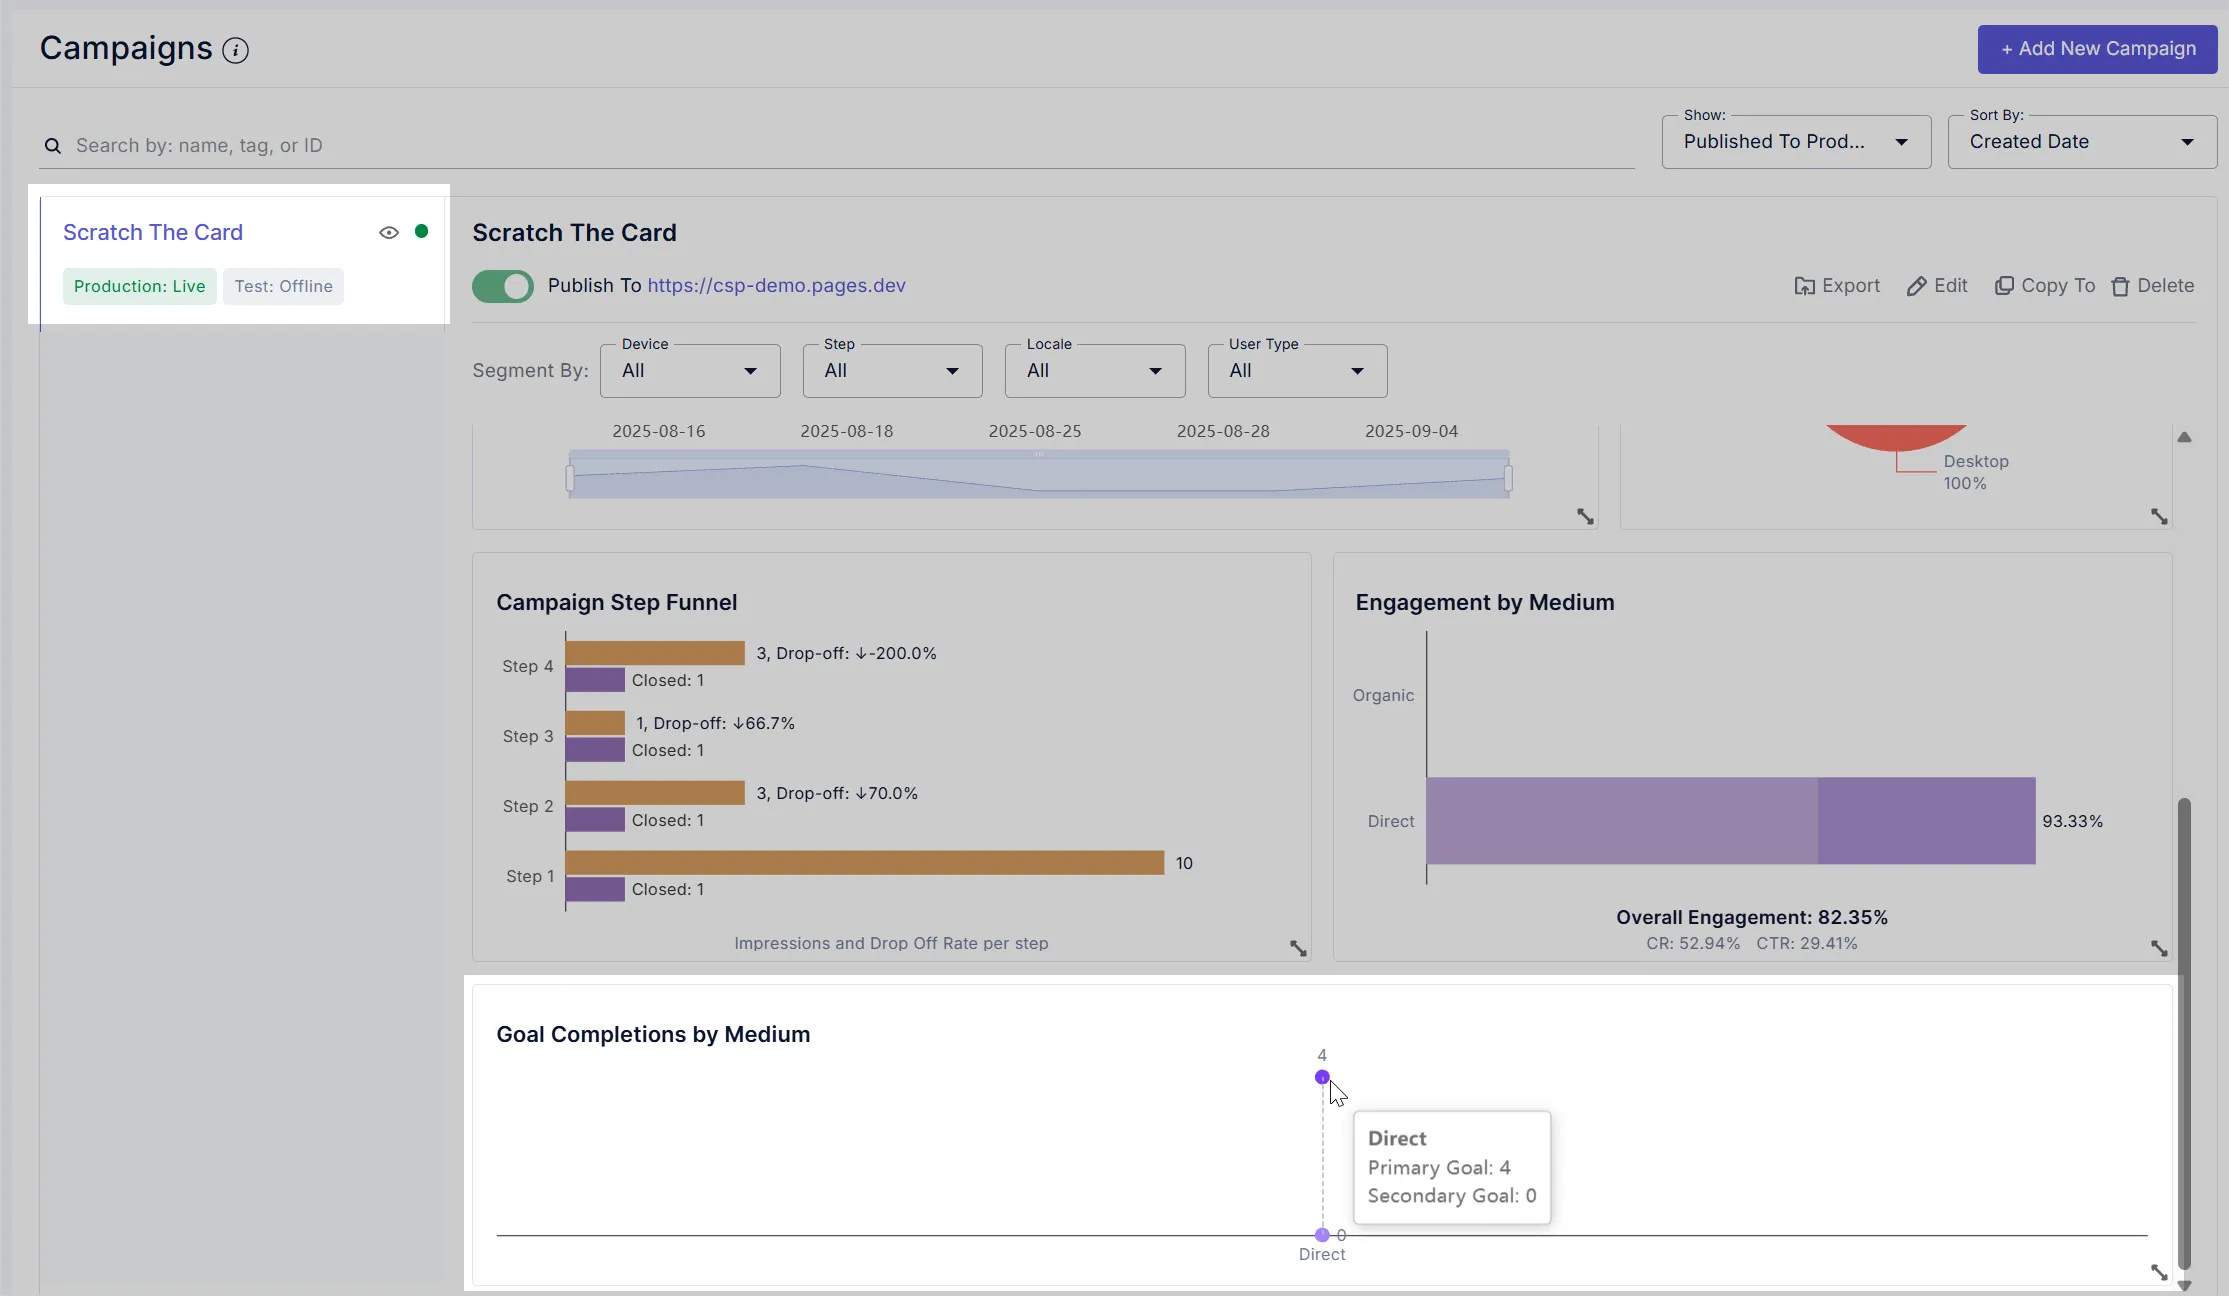
6. Goal Completions by Medium
Section titled “6. Goal Completions by Medium”This section displays how many users from each traffic source (Direct, Organic, Social, Email and Paid) finished a specific goal in your popup campaign. For each medium, the chart shows the exact number of completed goals, such as users who finished a form, claimed an offer, or completed another key action.
For example, in the image shared below, the graph shows “Direct: 4,” it means 4 users who came directly to your site achieved the goal. You can hover over each point to see details, like how many primary or secondary goals were completed from each source. This helps you quickly see which traffic sources are driving the most valuable actions for your campaign.
Viewing Graphs/Stats
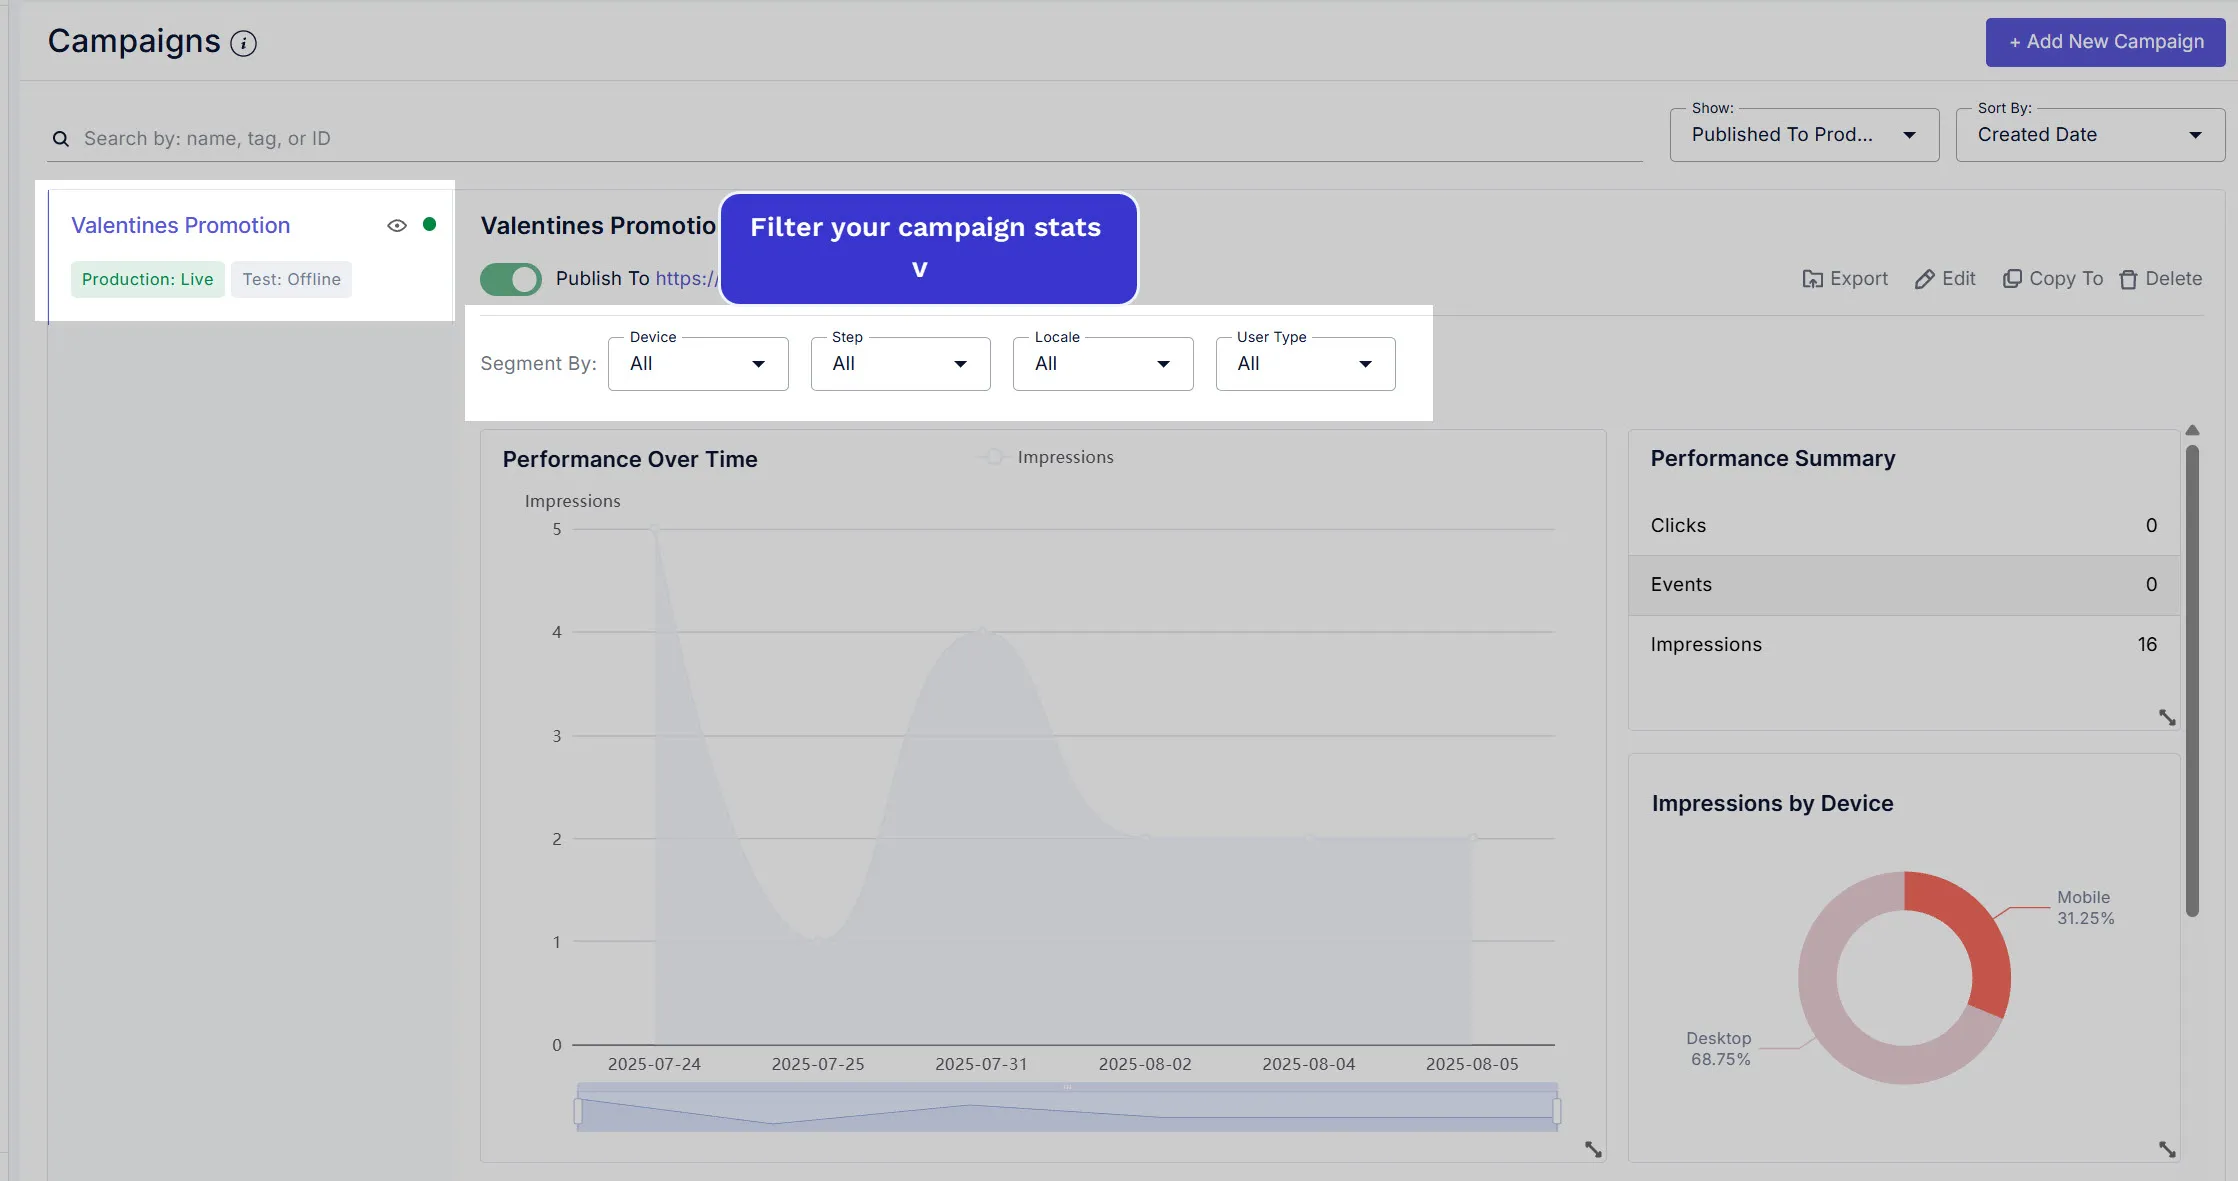
Section titled “Viewing Graphs/Stats”Using filters
Section titled “Using filters”You can use the filters shown at the top of the analytics dashboard to focus on specific groups of users and see how your campaign performs for them:
- Device: Switch between desktop or mobile to see stats for each device type.
- Step: Pick any step in the campaign to see detailed analytics for selected step.
- Locale: Filter by locale to learn how well your campaign performs in different locales.
- User Type Filter by user type.
Just click any filter and choose an option. The campaign charts and summaries will update instantly to show only the data for your selected segment. This helps you understand what works best for different devices, steps, locales, and user types, so you can make better decisions for your campaign.
Actions on graph/stats section
Section titled “Actions on graph/stats section”Here’s how you can get the most out of the graph and stats section:
Spot exact figures instantly: If you want to check numbers like impressions, clicks, or events for a specific date, just move your mouse over the spot on the graph you’re curious about. As soon as you hover, a tooltip will pop up showing you all the details for that point in time—no need to search or click around.
Customize your view: If you want to see more or less info, you can use the arrow at the bottom right of any stats section to open it up bigger or shrink it down, depending on what you want to focus on.
These simple moves help you find exactly what you’re after and keep your dashboard looking just the way you like it.
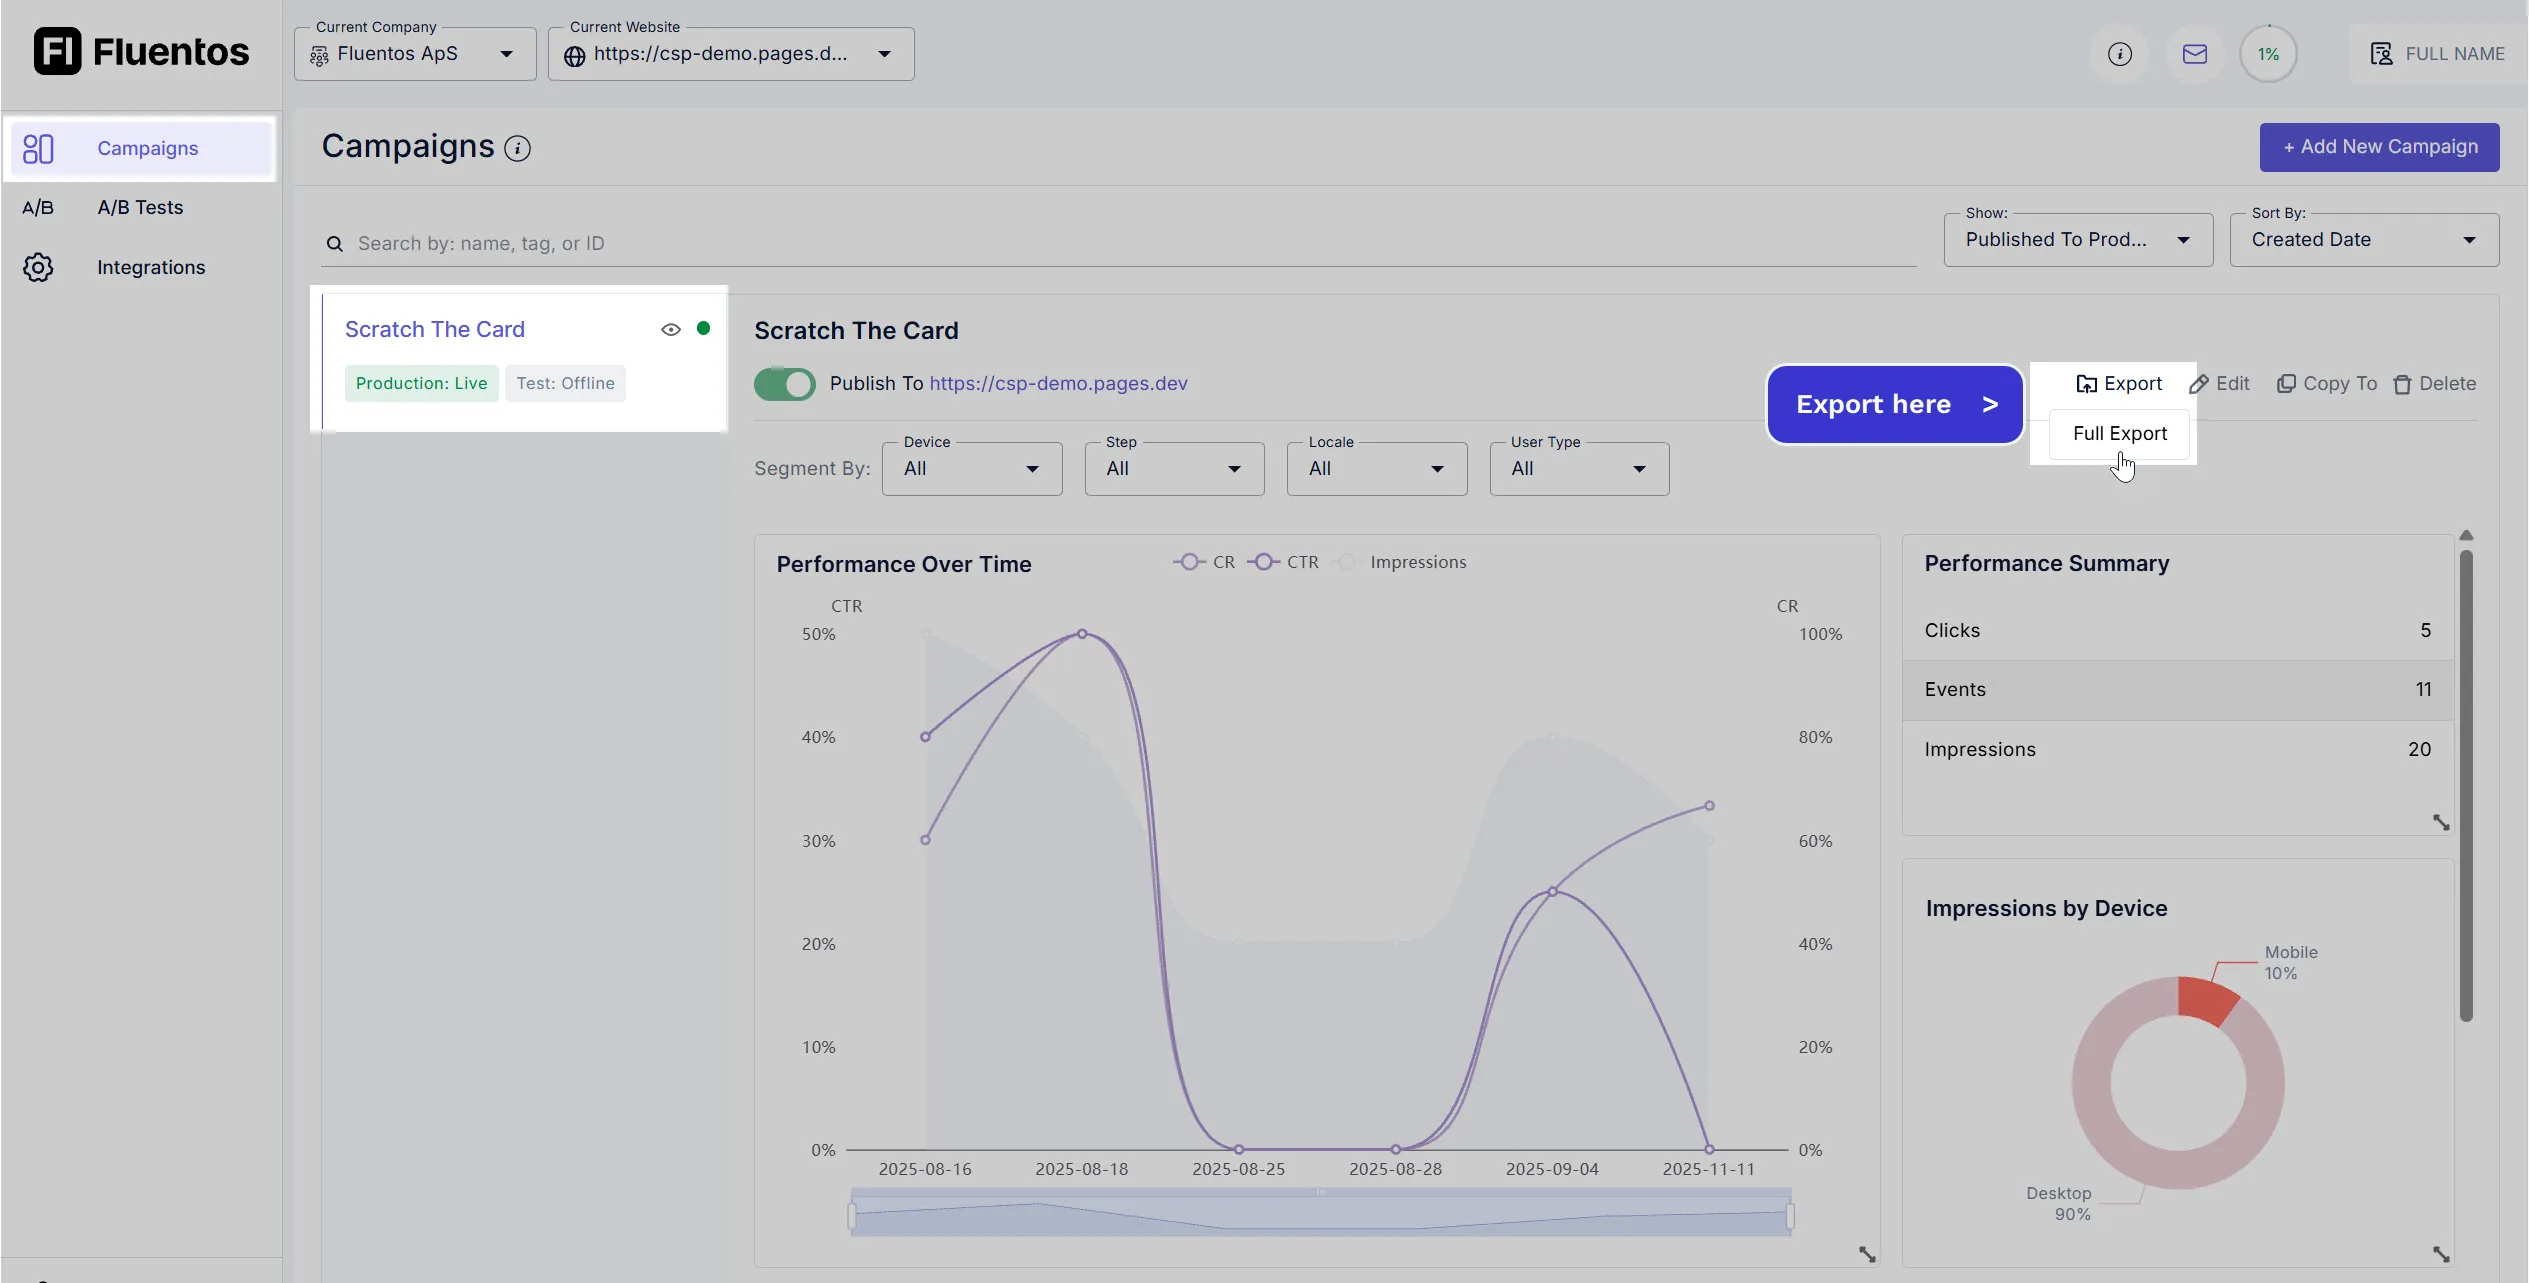
Export Campaign Analytics
Section titled “Export Campaign Analytics”You can easily export your campaign analytics by clicking the “Export” button at the top right of your campaign’s stats section (as highlighted in the image). Simply choose Full Export to download the detailed data for your campaign. When you do, your file will be downloaded in .CSV format (Comma-Separated Values), which is a standard type of spreadsheet file.
This export makes it easy to analyze your data further, share with others, or import into other tools for reporting. You can open the file in Excel or Google Sheets and filter, sort, or chart the results to find trends and insights that help improve your campaign.
Exportable stats
Section titled “Exportable stats”The downlaoded .CSV file includes the following important stats:
- Date each record was captured
- Medium: how users found your campaign (e.g., direct, organic)
- User Type: whether users are new or returning
- Device: desktop or mobile
- Step: which campaign step the data relates to
- Impressions, Events, Clicks, Closes, Expands, Minifies: breakdown of what users did at each step